Video Description:
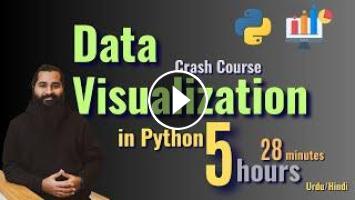
???? Master Data Visualization with Python: From Beginner to Advanced! ????
In this comprehensive Data Visualization Masterclass, we’ll guide you step-by-step through the most powerful Python libraries: Matplotlib, Seaborn, and Plotly. Whether you're a beginner or an experienced data analyst, this course will help you create stunning visualizations to tell compelling data stories.
What you’ll learn in this masterclass:
✔️ Matplotlib Basics: Build foundational visualizations
✔️ Seaborn Advanced: Statistical plots and customization
✔️ Plotly Interactive Dashboards: Dynamic and 3D plots
✔️ Best practices for designing impactful visualizations
✔️ Real-world examples and projects
This tutorial is perfect for students, professionals, and anyone looking to improve their data visualization skills for data science, business analysis, or presentations.
???? Don’t forget to like, comment, and subscribe for more tutorials! Let’s make your data come to life!
#DataVisualization #PythonTutorial #Matplotlib #Seaborn #Plotly #DataScience #DataAnalytics #VisualizeData #PythonForBeginners #AdvancedVisualization #codanics #urdu #babaammar #aammartufail #pakistan #urduai #pythonkachilla
You can book One to one consultancy session with me on Mentoga: https://mentoga.com/muhammadaammartufail
---------------------------------------------------------------------------------------------------------------------------------------
---------------------------------------------------------------------------------------------------------------------------------------
✅✅✅RoadMap to Data Analytics✅✅✅
Complete RoadMap to Become a Data Analyst in 2024.
Learn and Practice these skills and courses from our youtube Channel Codanics or our website www.codanics.com
The complete Data Analytics Course can be accessed here:
https://codanics.com/courses/data-analyst-summer-bootcamp/
You can also learn from our youtube channel www.youtube.com/@Codanics following this sequence.
1. MS Excel:
1. https://www.youtube.com/playlist?list=PL9XvIvvVL50G7D7_4ZDNAlS9JczrG57L6
2. https://www.youtube.com/playlist?list=PL9XvIvvVL50Hl4kVygAWYEpBXUteQlAiN
2. ABC of Statistics for Data Analytics and Data Understanding:
1. https://www.youtube.com/playlist?list=PL9XvIvvVL50FftePmir6RYd9r378DCQda
2. https://www.youtube.com/playlist?list=PL9XvIvvVL50H2YCvuZklqjBiqsJt_0KWI
3. Free Ebook written in Roman Urdu:
1. https://codanics.com/books/abc-of-statistics-for-data-science/
3. Mathematics for Data Analytics and Data Understanding:
1. https://www.youtube.com/playlist?list=PL9XvIvvVL50EFb5DokvHbunW6AsLtdMXh
2. https://www.youtube.com/playlist?list=PL9XvIvvVL50G3-_NMFreX72zbICK9-NW-
4. Power BI for Data Visualization
1. https://www.youtube.com/playlist?list=PL9XvIvvVL50GTwV7dqdBKxsFs7WYzlOYZ
5. Tableau for Data Visualization
1. https://www.youtube.com/playlist?list=PL9XvIvvVL50F5_vuj1805AMxpAms9HT6-
6. SQL (Structured Query Language)
1. https://www.youtube.com/playlist?list=PL9XvIvvVL50FszjOhcZw9WXIJQY6ZwV5g
7. Python for Data Analytics and Data Science
1. The whole python ka chilla for data science (Free main) is at this link: https://shorturl.at/vxGZ8
8. R programming:
1. Complete course on R is here: https://codanics.com/courses/r-with-aammar/
9. Bonus Complete Course on AI and Data Science:
1. Six months AI and Data Science Mentorship program is uploaded here: https://codanics.com/courses/six-months-of-ai-and-data-science-mentorship-program/
10. Markdown Language to Make Data Reports:
1. https://youtu.be/qJqAXjz-Rh4
Please share and like this video, also write your comment here and subscribe our channel.
---------------------------------------------------------------------------------------------------------------------------------------
✅Our Free Books: https://codanics.com/books/abc-of-statistics-for-data-science/
✅Our website: https://www.codanics.com
✅Our Courses: https://www.codanics.com/courses
✅Our YouTube Channel: www.youtube.com/@Codanics
✅ Our whatsapp channel: https://whatsapp.com/channel/0029Va7nRDq3QxRzGqaQvS3r
✅Our Facebook Group: https://www.facebook.com/groups/codanics
✅Our Discord group for community Discussion: https://discord.gg/QpvUKEtUJD
✉️For more Details contact us at info@codanics.com
Time Stamps:
00:00:00 Introduction
00:01:56 Data Visualization hy kia?
01:01:37 matplotlib and seaborn library
02:09:05 plot customization
02:28:33 plolty crash course
03:21:09 3D plots
03:59:27 Marginal Plots plotly
04:06:62 Animated plots
04:23:50 Multiple plots
04:34:51 Geospatial maps plots in plotly
05:09:15 Save plotly animation
- Category
- Artificial Intelligence & Business
- Tags
- urdu, codanics, baba aammar


Comments